Imagine planning a household survey in a rural village where access to a reliable and comprehensive sampling frame is limited or logistically challenging. OpenStreetMap may be useful in this context but the dataset is often riddled with inconsistencies. In my previous blog, we explored a method to extract households using OSM tags to guide sampling – an effective strategy in well-mapped areas. But what happens when these tags are inconsistent or missing altogether?
This time, we are diving into a grid-based sampling method—an alternative that ensures spatial coverage, regardless of the OSM data quality, and provides a more systematic approach to sampling, even in areas with varying household densities. Before diving into the grid-based approach, ensure that you have the essential Python packages installed. We will be using the same libraries as in our previous blog, along with shapely.geometry.Polygon to create grid cells. If you are new to Python, start by installing it here. Once your environment is set, we are ready to get started extracting the OSM data.
import osmnx as ox
import geopandas as gpd
import pandas as pd
import numpy as np
from shapely.geometry import Point, Polygon
import matplotlib.pyplot as plt
from matplotlib.patches import Rectangle
from matplotlib_scalebar.scalebar import ScaleBar
from geo_northarrow import add_north_arrow
Study Area and Data
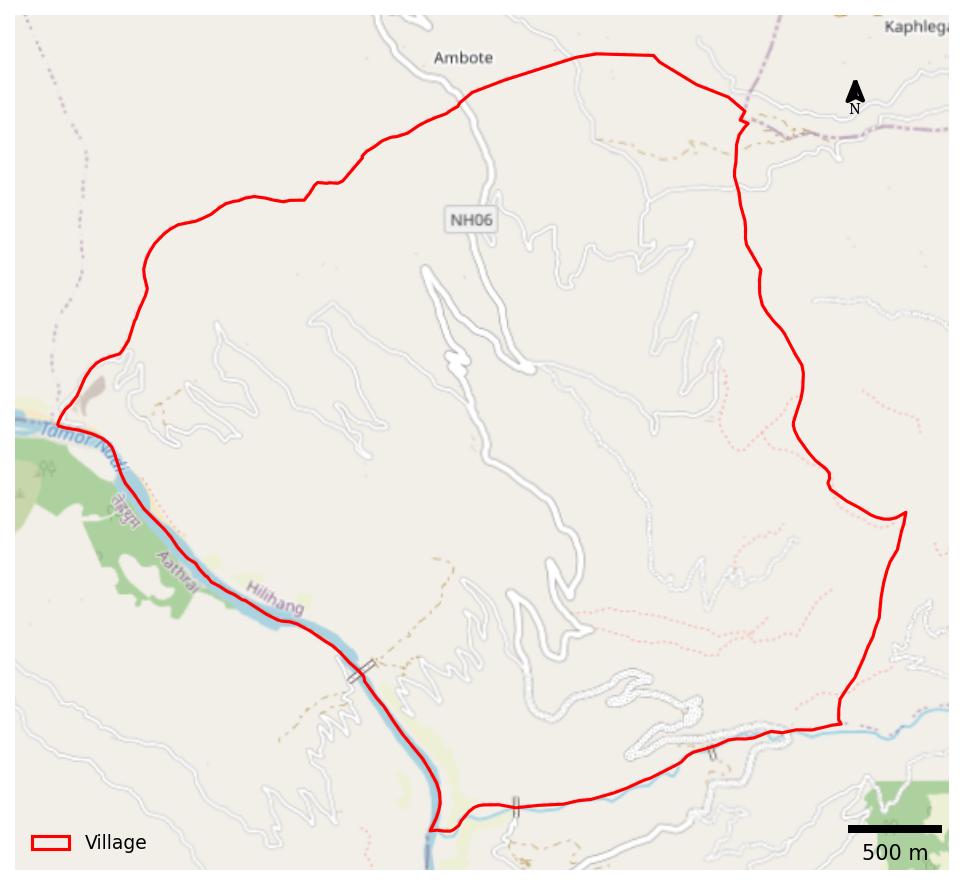
This blog focuses on Hilihang-4, a remote village in Eastern Nepal, characterised by scattered settlements, and mountainous terrain (see figure 1). In this region, the OSM data presents a significant limitation: building footprints are tagged only as building=yes, with no additional information about their use (residential, commercial, etc.) or their enclosing boundaries (school, park, residential zone etc.). This lack of detailed tagging makes it challenging to accurately identify residential zones and delineate hamlets, which were crucial steps in our previous method for stratifying households based on settlement patterns. In this blog, we assume that all the building footprints represent residential properties (i.e., households), a necessary assumption given the absence of information about building function and enclosing boundaries. The grid-based approach offers several advantages in this context. By systematically dividing the study area into equal-sized grids, we can ensure that all parts of the village are equally likely to be included in the sample, regardless of the distribution of households. We can ensure comprehensive spatial coverage and achieve a representative household sample, even with limited contextual information from OSM.
# Get the boundary of the study village
ward = "Hilihang-04, Panchthar, Koshi Province, Nepal"
boundary = ox.geocoder.geocode_to_gdf(ward)

# Collect all building footprints
tags_buildings = {"building":True}
try:
    buildings = ox.features_from_polygon(boundary.geometry.iloc[0], tags_buildings)
    print(f"Retrieved {len(buildings)} building features.")
except Exception as e:
    print(f"Error fetching buildings: {e}")
    exit()

# Reproject both datasets to a projected CRS for spatial operations
buildings = buildings.to_crs(epsg=32645)
boundary = boundary.to_crs(epsg=32645)

# Extract X, Y coordinates of households
buildings['centroid'] = buildings.geometry.centroid
buildings['centroid'] = buildings['centroid'].to_crs(epsg=4326)
buildings['longitude'] = buildings['centroid'].x
buildings['latitude'] = buildings['centroid'].y
Grid Construction
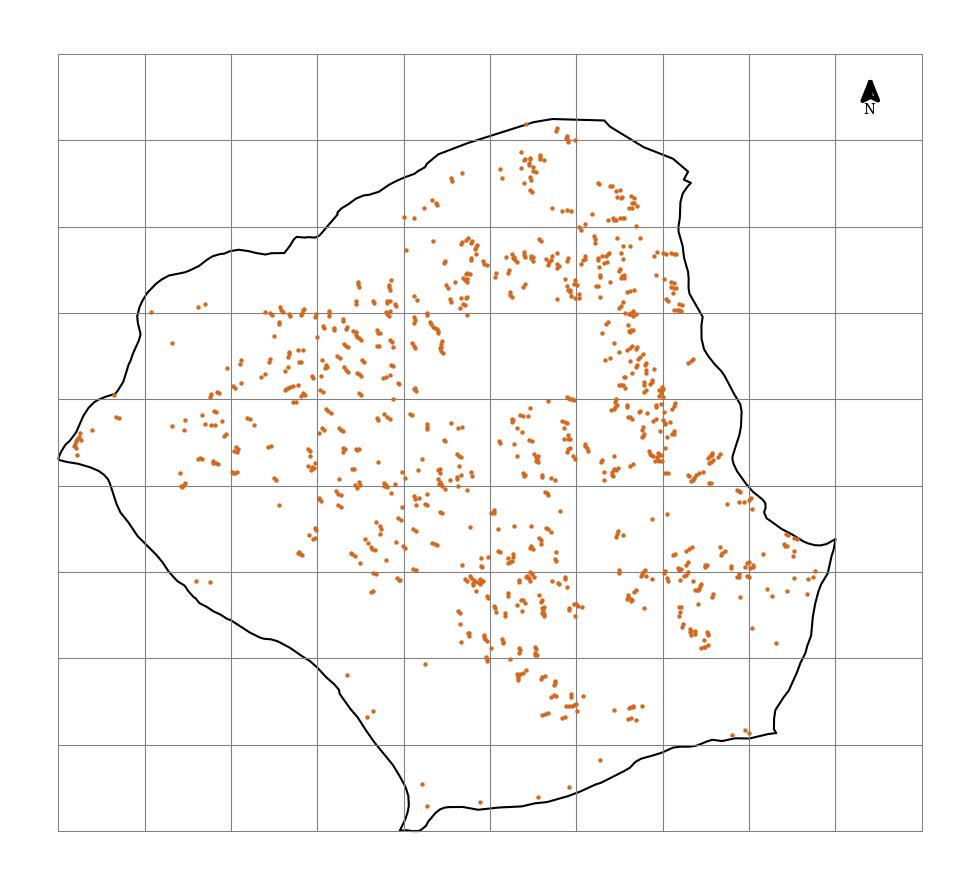
By creating grids, we are dividing the village into equal-sized (500m X 500m) imaginary clusters. Intuition plays a role here – you may imagine the grids as paving 500m by 500m square tiles onto the village (see figure 2). This effectively divides the village into a series of clusters, providing a structured framework for our sampling. Selecting the appropriate grid size requires careful consideration. There is no one-size-fits-all solution; the optimal grid size depends on various factors. You must carefully evaluate factors such as the desired level of spatial heterogeneity, household distribution patterns, and field logistics. Smaller grids may provide finer granularity, capturing subtle variations, but could increase sampling and logistic complexity. Larger grids, while simplifying logistics, might overlook such granularity and representativeness.
# Construct a grid cell of 0.5 X 0.5 Km
grid_size = 500  # Grid cell size of 0.5 km
grid_cells = [] # Empty list to store the grid cells

# Determine number of rows and columns of grids.
xmin, ymin, xmax, ymax = boundary.total_bounds
num_cols = int(np.ceil((xmax - xmin) / grid_size))
num_rows = int(np.ceil((ymax - ymin) / grid_size))

# Create grid cells
for i in range(num_rows):
    for j in range(num_cols):
        # Calculate cell boundaries
        x_min = xmin + j * grid_size
        x_max = x_min + grid_size
        y_min = ymin + i * grid_size
        y_max = y_min + grid_size

        # Create cell polygon
        cell_poly = Polygon([(x_min, y_min), (x_min, y_max), (x_max, y_max), (x_max, y_min)])

        # Add cell to list
        grid_cells.append({'geometry': cell_poly})
We clip the grids to the village boundary to ensure that sampling is restricted to the actual study area within the administrative boundary. We then utilise the sjoin function from the geopandas library to spatially join the household locations with the grid cells. Imagine it like this: each household is a point on the map, and we are trying to find which square tile that point falls within. The sjoin function efficiently performs this spatial operation, assigning each household to the grid cell that it intersects or is contained within. This process results in a new dataset, named hhlist, which contains the geo-coordinates of all households and their associated grid identifiers. After performing the necessary data cleaning on the hhlist dataset, we are ready to proceed with the household sampling.
# Clip grid cells to the village boundary
grid_df = gpd.GeoDataFrame(grid_cells, crs=boundary.crs)  # Set CRS from boundary
grid_df['area'] = grid_df.area # Calculate cell areas
grid_df = gpd.clip(grid_df, boundary)

# Assign each household to its immediate grid using a spatial join
hhlist = gpd.sjoin(
    buildings,
    grid_df,
    how="left",
    predicate="intersects"
)

# Clean the dataset
hhlist.reset_index(inplace=True)
hhlist = hhlist.drop_duplicates(subset='osmid', keep='first')
hhlist = hhlist.drop(columns = ["element_type", "nodes", "building", "geometry"])
hhlist.rename(columns={'osmid': 'hh_id', 'index_right': 'grid_id'}, inplace=True)
hhlist['centroid'] = hhlist['centroid'].to_crs(epsg=32645)
Sample Allocation
The OSM data yield a total of 1062 households in the study village, significantly higher than the 451 households reported in the census. This discrepancy, as discussed in the previous blog, is likely due to limitations in OSM data, such as over-representation of buildings or the inclusion of non-residential structures. To address this, we apply an adjustment factor (approximately 0.43 in this case) to scale down the estimated household counts within each grid.
However, this simple scaling approach may introduce biases. In areas where OSM significantly overestimates the actual number of households, the adjusted estimates might still be inflated, potentially leading to over-sampling. Conversely, in areas with accurate OSM data, the adjustment factor might lead to an underestimation of household density. A possible approach to mitigate this challenge is to conduct a pilot validation of building types within selected grids to refine the adjustment factor. Alternatively, incorporating local knowledge from community members could help to contextualize discrepancies between OSM data and ground truth.
# Calculate household density in each grid
hhlist['hh_size'] = hhlist.groupby('grid_id')['hh_id'].transform('count')
hhlist['density'] = hhlist['hh_size'] / hhlist['area']

# Calculate the adjustment factor and adjusted household size
census_total = 451
osm_total = len(hhlist)
afactor = census_total / osm_total
hhlist['adj_hh'] = (hhlist['hh_size'] * afactor).round().astype(int)

# Allocate sample sizes using PPS
total_sample = 200
hhlist['sample_size'] = (hhlist['adj_hh'] / census_total * total_sample).round().astype(int)

# Adjust sample sizes for densest grids
sample_adjustment = total_sample - hhlist.groupby('grid_id')['sample_size'].first().sum()

if sample_adjustment != 0:
    # Get indices of the densest grids
    dense_grid = hhlist.sort_values(
        'density', ascending=False)['grid_id'].unique()[:abs(sample_adjustment)]

    # Adjust sample size for each selected hamlets
    for grid_id in dense_grid:
        grid_adjustment = np.sign(sample_adjustment)

        # Update sample size for all households in the hanlet
        hhlist.loc[hhlist['grid_id'] == grid_id, 'sample_size'] += grid_adjustment
We allocate a total of 200 households across the grids using a probability proportional to size (PPS) method, similar to our previous approach. This ensures that grids with higher estimated household counts have a proportionally higher probability of being selected in the sample. Unlike the previous blog, where a minimum sample size of one household per hamlet was enforced, no such truncation is applied in this grid-based approach. We will see the implications of this decision, particularly the trade-offs between representativeness and the inclusivity of potentially sparse grid cells while visualising the sampled households on a map.
The subsequent steps, including randomly selecting households within each grid to match the allocated sample size and visualising the sampled households on a map, closely follow the procedures outlined in the previous blog. The corresponding code for these steps is not reproduced here for brevity. You may refer to the previous blog for detailed illustration and adapt the code to your specific needs.
Data Visualisation
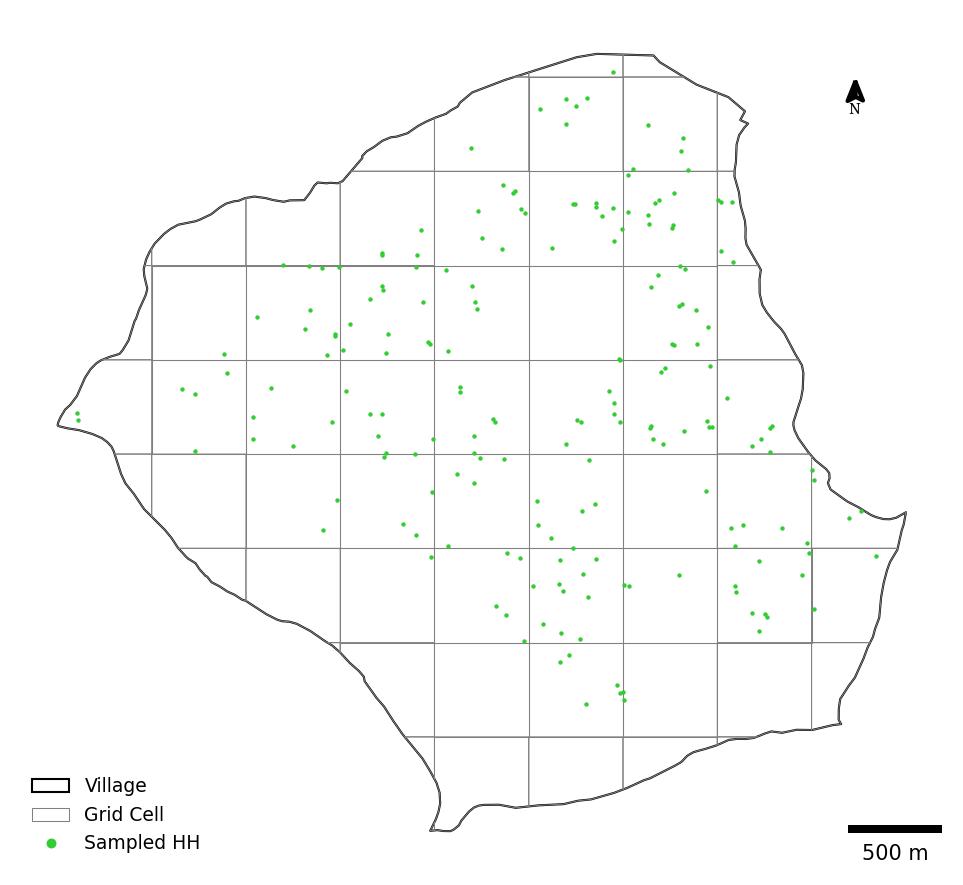
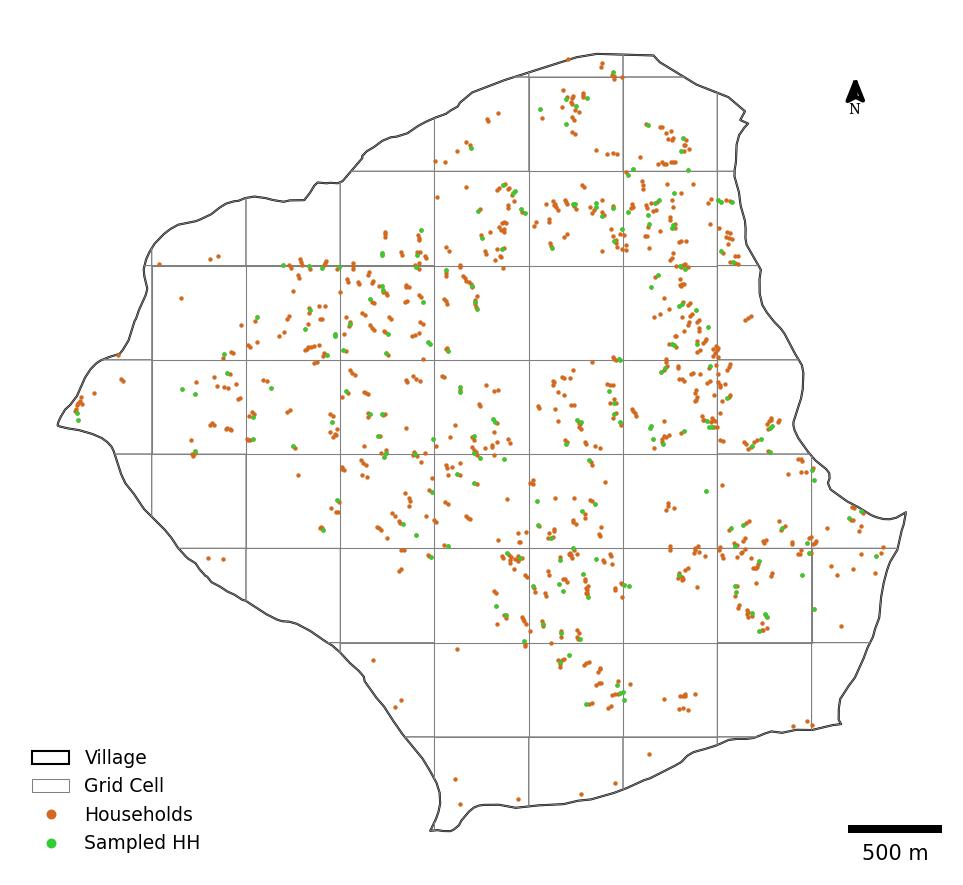
We now overlay the sampled households on the village boundary and the gridded structure to demonstrate the spatial distribution of the sampled households across the village. As expected, the spatial distribution of sampled households is not uniform (see figure 3). Girds with higher household densities have a higher concentration of sampled households. This pattern confirms the effectiveness of the PPS sampling method in targeting areas with a higher concentration of households. However, we observe that grids with very few households, particularly those located towards the southwestern boundary of the village, have null sampled households (see figure 4). This under-representation of sparsely populated areas could potentially introduce bias into the study if these areas possess unique characteristics or represent important sub-populations within the village. Would you prioritise inclusivity or representativeness? How your choice might shape field logistics and research outcomes?


Concluding Remarks
Grid-based sampling offers a robust and flexible approach to household selection, particularly in scenarios where traditional sampling frames are unavailable or limited. By systematically dividing the study area into a grid and utilising readily available data sources like the OSM data, this method provides a structured framework for ensuring a representative sample. However, researchers must carefully consider the quality and limitations of the OSM data, as well as the desired level of representativeness, when implementing this approach.
I end the two-part series on GIS-based sampling techniques here. In the next blog, we will explore into another pertinent domain of field research methodology. Until then, I encourage you to explore the feasibility and applicability of GIS-based sampling in your own research contexts, considering the unique challenges and opportunities presented by your specific study areas and research objectives.